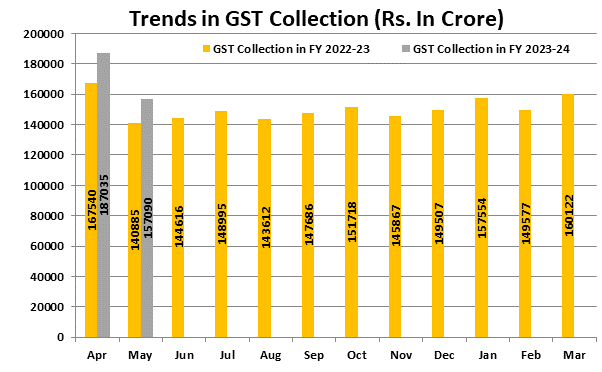
* The Goods & Services Tax (GST) revenue collected in the month of May 2023 rose 12% on an annual basis to Rs 1.57 lakh crore. The Finance Ministry reported the GST collections for the month of April 2023 at Rs 1.87 lakh crore, the highest ever.
* "GST revenue collected in the month of May, 2023 is Rs 1,57,090 crore of which CGST is Rs 28,411 crore, SGST is Rs 35,828 crore, IGST is Rs 81,363 crore (including Rs 41,772 crore collected on import of goods) and cess is Rs 11,489 crore (including Rs 1,057 crore collected on import of goods)," said Ministry of Finance in a statement.
* Monthly GST revenues more than Rs 1.4 lakh crore for 14 months in a row, with Rs 1.5 lakh crore crossed for the 5th time since inception of GST," said the ministry about the May collection. GST collection in May last year was about Rs 1.41 lakh crore.
* The revenues for the month of May 2023 are 12% higher than the GST revenues in the same month last year. During the month, revenue from import of goods was 12% higher and the revenues from domestic transactions (including import of services) are 11% higher than the revenues from these sources during the same month last year.
* The chart below shows trends in monthly gross GST revenues during the current year. The table shows the state-wise figures of GST collected in each State during the month of May 2023 as compared to May 2022.
State-wise growth of GST Revenues during May 2023 :
| State/UT |
May-22 |
May-23 |
Growth(%) |
| Jammu and Kashmir |
372 |
422 |
14 |
| Himachal Pradesh |
741 |
828 |
12 |
| Punjab |
1833 |
1744 |
-5 |
| Chandigarh |
167 |
259 |
55 |
| Uttarakhand |
1309 |
1431 |
9 |
| Haryana |
6663 |
7250 |
9 |
| Delhi |
4113 |
5147 |
25 |
| Rajasthan |
3789 |
3924 |
4 |
| Uttar Pradesh |
6670 |
7468 |
12 |
| Bihar |
1178 |
1366 |
16 |
| Sikkim |
279 |
334 |
20 |
| Arunachal Pradesh |
82 |
120 |
47 |
| Nagaland |
49 |
52 |
6 |
| Manipur |
47 |
39 |
-17 |
| Mizoram |
25 |
38 |
52 |
| Tripura |
65 |
75 |
14 |
| Meghalaya |
174 |
214 |
23 |
| Assam |
1062 |
1217 |
15 |
| West Bengal |
4896 |
5162 |
5 |
| Jharkhand |
2468 |
2584 |
5 |
| Odisha |
3956 |
4398 |
11 |
| Chattisgarh |
2627 |
2525 |
-4 |
| Madhya Pradesh |
2746 |
3381 |
23 |
| Gujarat |
9321 |
9800 |
5 |
| Dadra and Nagar Haveli and Daman and Diu |
300 |
324 |
8 |
| Maharashtra |
20313 |
23536 |
16 |
| Karnataka |
9232 |
10317 |
12 |
| Goa |
461 |
523 |
13 |
| Lakshadweep |
1 |
2 |
210 |
| Kerala |
2064 |
2297 |
11 |
| Tamil Nadu |
7910 |
8953 |
13 |
| Puducherry |
181 |
202 |
12 |
| Andaman and Nicobar Islands |
24 |
31 |
27 |
| Telangana |
3982 |
4507 |
13 |
| Andhra Pradesh |
3047 |
3373 |
11 |
| Ladakh |
12 |
26 |
113 |
| Other Territory |
185 |
201 |
9 |
| Center Jurisdiction |
140 |
187 |
34 |
| Grand Total |
102485 |
114261 |
11 |
Source : PIB
